Know your numbers. Grow your business.
Clear, actionable insight into every corner of your business — revenue trends, client retention, top services, and staff performance — without opening a spreadsheet.
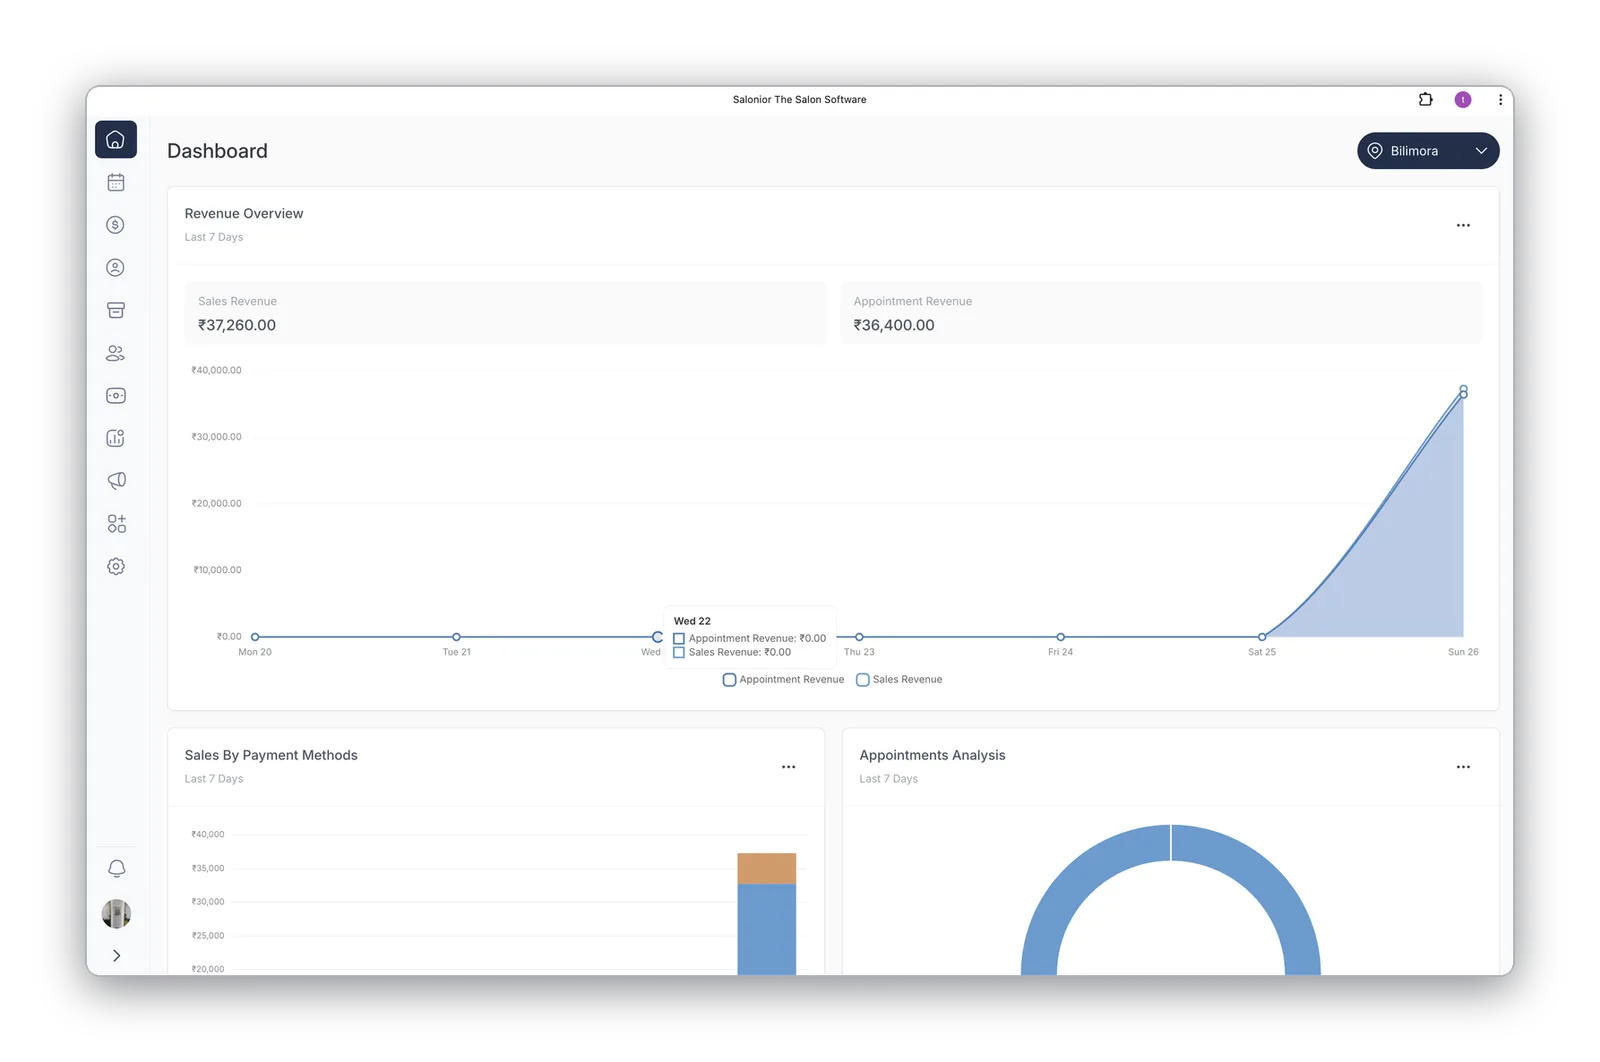
Revenue dashboard
Today's revenue, this week's total, and month-over-month trends in one clean view.
- Know if you're ahead or behind, any day
- Top services by revenue and volume
- Busiest hours and days at a glance
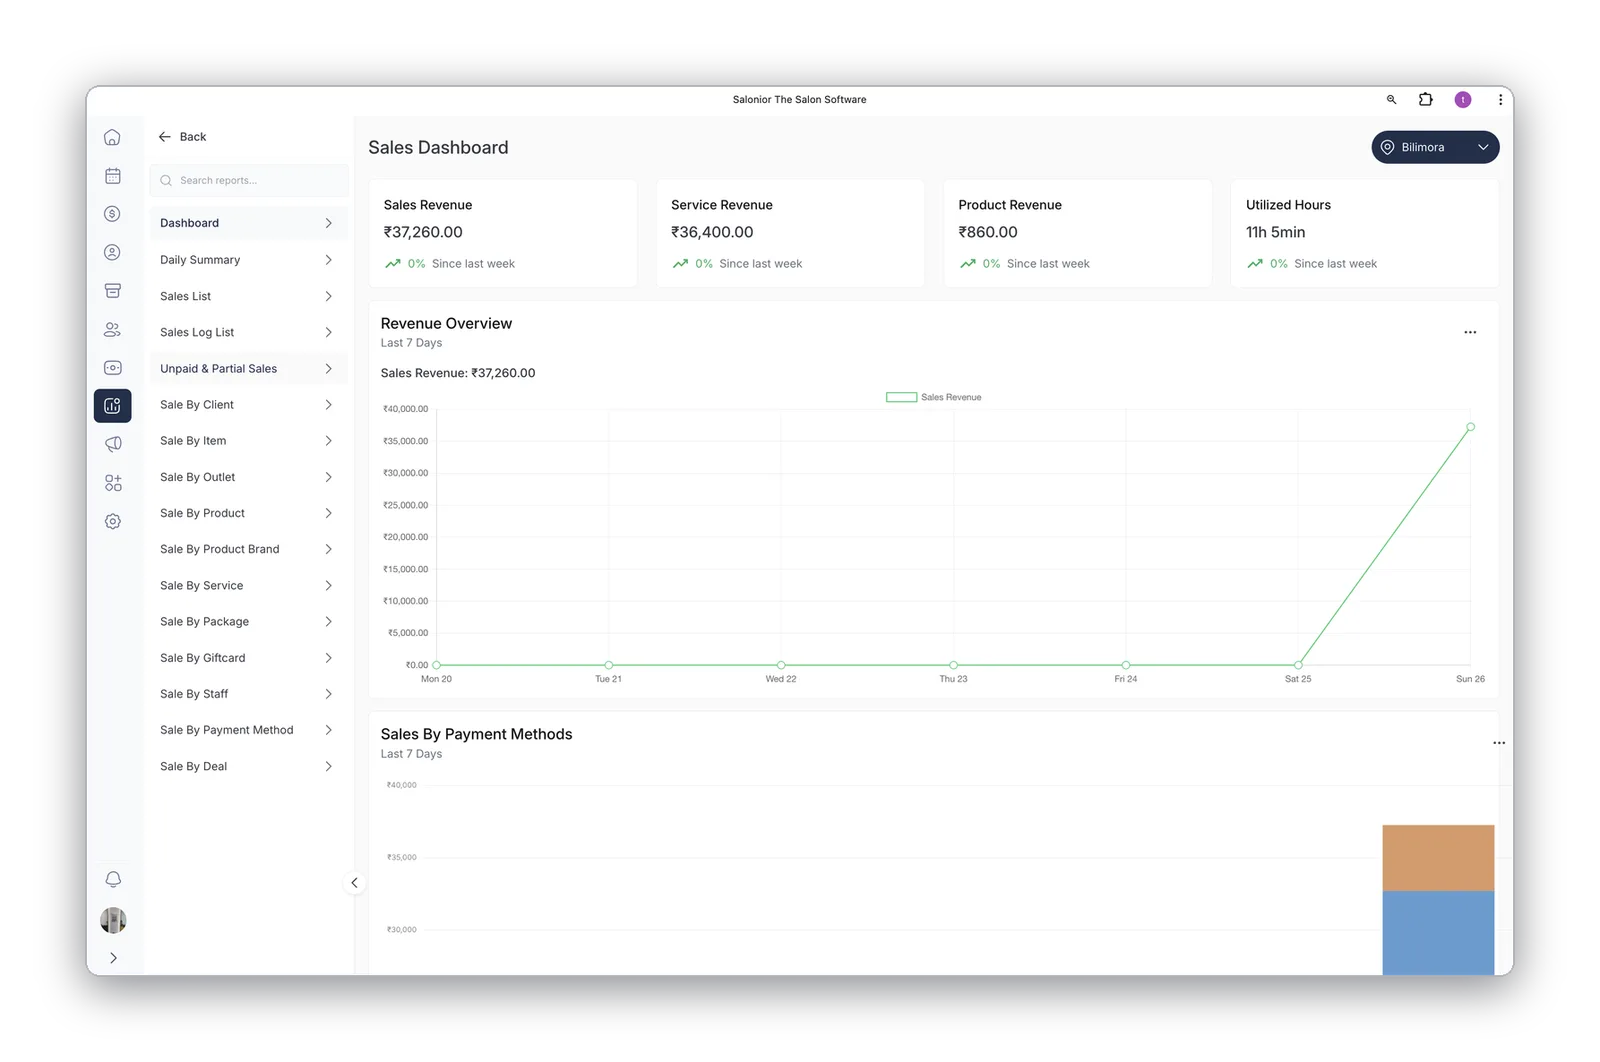
Retention & no-show analytics
Returning vs. lost clients, visit frequency, lifetime value, and at-risk clients who haven't booked recently.
- No-show patterns by client, service, and time slot
- Adjust reminders and deposit policy with data
- Export any report as CSV for your accountant
Which numbers to check, and how often
Salon software can produce dozens of reports, and that is exactly the problem — most owners glance at revenue and ignore the rest. A handful of numbers, checked on a rhythm, tells you more about the health of the business than the bank balance does.
Weekly, look at revenue broken down rather than revenue as a headline: services versus retail, by stylist, and by location if you run more than one. A month can look flat overall while retail quietly collapses or one stylist carries the team — and that only shows up in the breakdown. Alongside it, check your rebooking rate, the share of clients who book their next appointment before they leave. It is the single best predictor of next month's revenue.
Monthly, look at client retention — the share of clients returning within their expected cycle — and your average bill, which is total revenue divided by visits. Raising the average bill even slightly flows almost entirely to profit, because rent and salaries are already covered. Finish with revenue, rebooking and retail per stylist, which turns coaching conversations into conversations about numbers rather than opinions.
Setting this up for the first time? Which salon reports to track, and how to read them walks through it step by step.
Reports & Analytics — the questions we get asked
Five: revenue broken down by service versus retail and by stylist, rebooking rate, client retention, average bill, and per-stylist performance. Everything else is detail you can go looking for when a number moves unexpectedly.
Yes — any report exports as CSV, so month-end handover is a download rather than a rebuild.
Yes. Multi-location accounts get both per-branch and rolled-up brand-level reporting, so you can compare outlets side by side or look at the group as a whole.
What reports & analytics connects to
Payroll & Commissions
The same per-staff numbers that drive coaching also drive pay runs.
Explore payroll & commissions →Multi-Location
Compare branches side by side, or roll every outlet into one view.
Explore multi-location →Client Management
Retention and lifetime value read straight off your client records.
Explore client management →Explore Salonior by business type…
…or keep exploring features
Reports & Analytics is included in every Salonior plan.
Fair yearly pricing — no add-ons, no feature gates, 0% commission.